")
")
Ishikawa diagram and root cause analysis
1. How to use the Ishikawa diagram for root cause analysis - General method
Here is the general method for addressing a problem within an organization using the Ishikawa / cause and effect diagram:
- Form a team: Gather a group of individuals with relevant skills and expertise for the problem you are attempting to address. This might include employees from various departments, managers, technical experts, and other stakeholders concerned with the issue.
- Clearly define the problem: Before beginning, ensure the team has a shared and clear understanding of the problem you aim to address. Define the undesired effect or the objective to be met in a specific and measurable manner.
- Create the Ishikawa diagram:
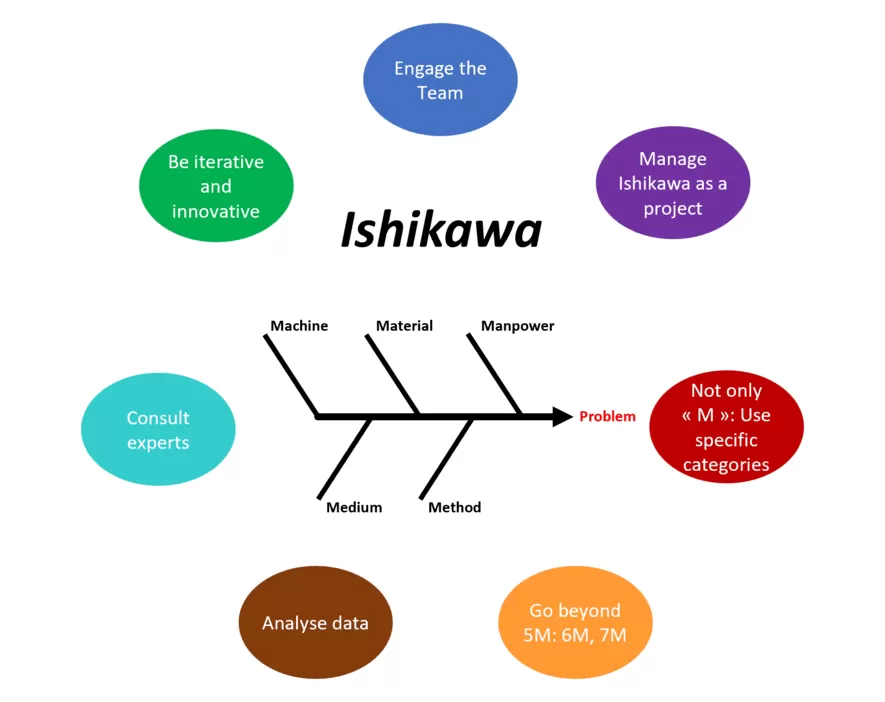
- Create the main column: Draw a horizontal line resembling a fish's spine stemming from the identified problem. This column signifies the effect or the core problem you're analyzing.
- Establish cause categories: Preliminarily identify the general cause categories most relevant that might contribute to the undesirable effect. These categories often resemble "bones" branching out from the main column, hence the "fishbone diagram" name. The original method's categories are the 5 Ms: Machines, Manpower, Material, Methods, and Medium (often called Environment). We will further delve into category selection later on.
- Brainstorming: Organize brainstorming sessions with the team to pinpoint as many causes as possible. Advocate for the uninhibited expression of ideas without judgment. The objective is to generate a plethora of hypotheses about the potential causes of the problem. It's vital to understand that, at this juncture, the causes aren't necessarily verified or root ones.
- Deepening and structuring of causes: After generating the preliminary list of causes, the team transitions to the deepening and structuring phase. This is where you commence the in-depth exploration of each cause to discern why it occurs. Iteratively pose the question, "Why does this happen?" to probe further and unearth underlying causes. At this stage, you can also discern causal relationships between causes and cluster them into secondary bones (branches) for enhanced organization and comprehension.
- Prioritization: With a list of potential causes in hand, instruct the team to rank them based on their significance and impact on the issue. This assists in focusing on the most pivotal causes.
- Cause analysis: Delve deeper into the most paramount causes. For each, ascertain why they transpire and what evidence backs them. It may be requisite to gather data and embark on more comprehensive investigations.
- Action plan: Once the primary causes are discerned and understood, devise an action plan to tackle them. Allocate explicit responsibilities to each team member to initiate corrective measures.
- Monitoring and ongoing enhancement: Instigate a monitoring mechanism to gauge the effectiveness of the corrective actions. If need be, modify the action plan grounded on the results achieved. Ensure the improvements are sustained and embed them within the organization's practices.
- Communication: Update the entire organization regarding the outcomes of your analysis and the corrective steps undertaken. Transparency and open communication foster commitment and collaboration from the entire staff.
2. How to identify the true root causes and prioritize them with the Ishikawa diagram
Identifying and prioritizing the true root causes of a problem can be challenging, and sometimes it is necessary to go through iterations or loops to gain a deeper and more accurate understanding. Here are the common challenges and how to address them, indicating at which stages of the Ishikawa diagram method they occur.
2.1. Identification stage (Brainstorming)
Difficulty: It may be challenging to identify all potential causes in the first pass, or there might be a tendency to focus on symptoms rather than the real causes. Participants might also hesitate to share critical information for fear of blame.
Tips:
- Encourage an open and non-judgmental environment where team members feel comfortable sharing their observations and insights.
- Ask open-ended questions to stimulate thinking about potential causes. For example, ask "Why is this happening?" or "What circumstances contribute to this problem?"
- Use creative brainstorming techniques to explore different perspectives and ideas.
- Use historical data, surveys, and interviews to gather accurate information.
2.2. Deepening and structuring causes stage
Difficulty: It may be challenging to determine which causes are direct causes of the problem and which are deeper or secondary causes. There may also be a feedback loop where you're unsure if a cause is genuinely the cause or an effect of the problem.
Solutions:
- Continually ask the question "Why is this happening?" to dig deep and uncover cause after cause. For instance, when you identify a direct cause, ask why that cause exists until you reach a more fundamental cause.
- When faced with loops, consider whether there are one or more causes that lead to both the "cause and effect," implying that both are in fact two "effects."
- Engage experts or stakeholders with deep process understanding to help identify underlying causes.
2.3. Cause prioritization stage
Difficulty: It might be challenging to determine which causes are most significant or influential, especially when faced with a long list of potential causes.
Tips:
- Use prioritization methods like the impact/effort matrix to assess the impact of each cause against the effort required to address it.
- Engage the team in the prioritization process using voting or rating techniques.
- Consider the strategic importance of the causes, focusing on those with the most significant impact on the organization's goals.
- Use quantified data (e.g., Pareto charts), or if needed, undertake measurements or data analysis.
2.4. Cause analysis stage
Difficulty: A superficial analysis of causes can lead to erroneous conclusions or ineffective solutions. Causes might also be interconnected, complicating their identification and understanding.
Tips:
- Use analysis tools like the "5 Whys" to delve deep and identify underlying causes. Repeatedly ask the question "Why is this happening?" until you reach the root cause.
- Engage experts or stakeholders with deep knowledge of the process or issue for more accurate analysis.
2.5 Iterations and non-linear Ishikawa diagram process
Some stages of the Ishikawa diagram process might require iterations or loops for a more comprehensive understanding. For example, after prioritizing causes, you might find that interconnected causes need revisiting. You might also revert to the identification stage if new insights or observations arise.
Often, it becomes necessary to backtrack to further explore causes or adjust prioritization based on new findings. This leads to conducting multiple workshops, interspersed with measurement activities, data analysis, and expert consultations.
3. Categorization of causes in the Ishikawa diagram
The categorization of causes in an Ishikawa diagram helps organize potential causes into logical groups to facilitate problem analysis. It should be as relevant as possible depending on the context to facilitate reflection.
3.1 Original causes
Original causes of the Ishikawa diagram were created in the 60s, in the context of quality improvement in a production environment. These are the "5Ms":- Machines: The equipment, machines, or tools used in the process.
- Materials: The raw materials, components, materials used in production.
- Manpower: The people involved in the process, including their skills and training.
- Methods: The procedures, working methods, and processes used.
- Medium (or Environment): Environmental factors such as temperature, humidity, lighting, etc., which can influence the process.
3.2 The "6M" and "7M"
The addition of the categories "Management" and "Measurement" (6M and 7M) was made to take into account the increasing importance of quality measurement data in production processes and better consideration of management-related factors.The 6M with the addition of Management: Factors related to direction, supervision, and process management. This may include planning, communication, decision-making, etc. When this sixth M is used, it is important to differentiate it well from the M for Method.
The 7M with the addition of Measurement: Measurement systems, instruments, and control procedures used to monitor and measure the process.
3.3 Other environments
The original list of "5M" in the Ishikawa diagram was designed for a production environment and is not necessarily fully adapted to other environments.Here is a non-exhaustive list of categorization adapted to different environments. You will see that it is not necessary to keep the "M".
Furthermore, it is important to understand that these are just examples, and it is about choosing the most suitable categorization for your environment. It is even possible, and recommended, to modify the categorization after a first round of identifying potential causes if it proves relevant.
3.3.1 Support or administrative functions
Process: Problems related to inefficient processes, poorly designed workflows, non-standardized procedures, delays in workflow, etc.
Technology and IT Systems: Software problems, hardware, network connectivity, etc.
Human Resources: Problems related to staff, such as lack of training, workload overload, insufficient internal communication, motivation issues, etc.
Communication: Internal and external communication problems, including information transmission, mutual understanding, collaboration, etc.
Policies and Procedures: Problems related to administrative policies and procedures, such as compliance with policies, frequent procedure changes, etc.
Organizational Culture: Problems related to the organization's culture, like resistance to change, excessive bureaucracy, lack of innovation, etc.
Internal Customers: Problems related to interactions with internal customers, expectation management, delays in responding to requests, etc.
Data Quality: Problems related to data quality, including accuracy, consistency, and data integrity.
3.3.2. Sales
Customers and Market: Problems related to customers, their needs, market demand, trends, and purchasing behaviors.
Strategy and Planning: Problems related to business strategy, sales planning, goal setting, team alignment, etc.
Products and Services: Problems related to the products or services offered, their quality, relevance to the market, features, characteristics, etc.
Competition: Problems related to market competition, competitive analysis, competitor actions, differentiation, etc.
Sales Teams: Problems related to the performance of sales teams, training, motivation, territory management, customer management, etc.
Marketing Communication: Problems related to marketing campaigns, advertising, promotion, communication with customers, etc.
Sales Process: Problems related to the sales process, sales steps, process efficiency, Customer Relationship Management (CRM) tools, etc.
Technology and Tools: Problems related to sales technologies, sales management systems, automation tools, etc.
3.3.3. Research and Development
R&D Process: Issues related to research and development processes, methodologies, development cycles, testing protocols, etc.
Innovation and Creativity: Issues related to generating innovative ideas, the creativity of the R&D team, innovation management, etc.
Human Resources: Issues related to members of the R&D team, their expertise, their motivation, talent management, training, etc.
Technology and Tools: Issues related to R&D tools, technologies, laboratory equipment, modeling software, etc.
Internal and External Collaboration: Issues related to communication and collaboration among R&D teams, as well as with external partners, suppliers, and universities.
Project Management: Issues related to managing R&D projects, planning, deadline tracking, resource management, etc.
Technological Monitoring: Issues related to collecting and analyzing information on technological trends, patents, competition, etc.
Intellectual Property Management: Issues related to the protection of intellectual property rights, patent management, trademarks, and copyrights.
Management Support: Issues related to management's commitment to R&D, resource allocation, strategic decision-making, etc.
3.3.4. Logistics and Supply Chain Services
Logistics Processes: Issues related to supply chain management processes, demand planning, inventory management, transportation, distribution, etc.
Partners and Suppliers: Issues related to relations with business partners, suppliers, subcontractors, logistics service providers, etc.
Technology and Systems: Issues related to IT systems for supply chain management, inventory tracking tools, planning software, etc.
Logistics Infrastructure: Issues related to storage facilities, warehouses, transport infrastructure, handling equipment, etc.
Human Resources Management: Issues related to supply chain personnel, training, skills management, workforce planning, etc.
Security and Compliance: Issues related to the security of logistics operations, quality standards, regulatory compliance, risk management, etc.
Demand and Planning: Issues related to demand forecasting, production planning, procurement planning, etc.
Sustainability and Social Responsibility: Issues related to environmental sustainability, corporate social responsibility (CSR) in the supply chain, ethical practices, etc.
Communication and Collaboration: Issues related to internal and external communication and collaboration, especially with customers, carriers, service providers, etc.
Crisis Management: Issues related to crisis management, business continuity plans, disruption risk management, etc.
4. Ishikawa diagram: conclusion
Identifying the actual root causes is essential in the problem-solving process for rapid and sustainable improvement of an organization's efficiency.
However, this process can prove to be complex, non-linear, quite lengthy, and resource-intensive, even becoming a true "project" within the problem-solving process. It is therefore essential to strictly follow the general problem-solving process, especially the initial problem clarification phase. It's during this phase that the task's difficulty should be estimated to implement the right mechanism... and effectively use the Ishikawa / cause and effect diagram.
When you subscribe to the blog, we will send you an e-mail when there are new updates on the site so you wouldn't miss them.
Comments